Showing posts with label Weekly Market Reviews. Show all posts

Stock Market Indices Review for Week 37 in 2015

Sep 11, 2015 -

Stock Market Highlights - Week 37


- Dow had worst August decline in 17 years and the NASDAQ its worst August in 14 years.
- WTI was $44.63 and brent crude oil $48.14 on 9/11. Prices still holding 40s.
- S&P trailing-12-month US corporate default rate was at a two-year high of 2.4% in August.
- Blackstone agreed to acquire Strategic Hotels & Resorts for approximately $6 billion.
- Box beats with $73.5M in revenue in Q2 2016, hits 50K customers.


The Dow Jones Industrial Average (DJIA) closed at 16433.08, which was about a 330 point increase versus a week ago of 16102.38 on Friday, September 4th 2015. 

The DJIA now formed a trading triangle, which we will await to see whether it breaks up or break down. While it briefly tested the 20 DMA, we didn't see follow through action and therefore any shorts from the 20 DMA were most likely covered in the subsequent days. Right now we are pretty much in no man's land with 50/50 odds of where the market will go.


The S&P 500 closed at 1961.05 on Friday, September 11th 2015 versus a week ago of 
1921.22 on Friday, September 4th 2015. This was about a 40 point swing. What we saw in the DJIA is almost mirror of what we see in the SPX. A break in either direction would cause us to put our cash to work. 


The Nasdaq (COMPQ) closed at 4822.34 on September 11th, 2015 versus 4683.92 on September 4th, 2015. There is a bit more strength in the COMPQ versus the DJIA and the SPX. This index is definitely leaning more bullish as you can see this is the only one to have closed above the 20 DMA. We'll see if this price level holds. This might be an indicator that the break of the triangle for DJIA and SPX will be upward. However, we'll follow the price action and time will tell. 


Starbucks (SBUX) is one of the stronger charts that has recovered after what seems to be a minor correction. Whether or not it holds the 20 DMA will be something to watch. Keep in mind the trendline is still broken and until another upward trend sets up, this chart is just making lower highs and lower lows. However, keep this on the watch list if the market turns bullish.


Disclosure: We did not have a position in SBUX at the time this article was first written.

The information provided on this site is not advice to buy, sell, hold, trade, or invest in any securities. I am not a financial professional. Do your own research before acting on any information provided on this site.
[Continue reading...]

Stock Market Indices Review for Week 36 in 2015

Sep 5, 2015 -

Stock Market Highlights - Week 36


- U.S. job growth slowed in August; unemployment rate near 7-1/2-year low.
- WTI was $46.05 and brent crude oil $49.61 on 9/5. Beginning signs of reversal?
- BlackBerry to buy security firm Good Technology for $425 million.
- Toyota announces $50 million investment into artificial intelligence.
- Apple's $10,000 gold watch fails to impress investors.
.

The Dow Jones Industrial Average (DJIA) closed at 16102.38, which was about a 540 point decrease versus a week ago of 16643.01 on Friday, August 28th 2015. 

The DJIA has just about gapped up or down everyday last week. Still there were good trading opportunities for day traders throughout the day. We saw two dojis that confirmed short term trend changes one on Thursday of last week and the Friday August 28th. The bounces were sold with conviction. If you went short and held overnight on those two occasions, you would've made out pretty well.


The S&P 500 closed at 1921.22 on Friday, September 4th 2015 versus a week ago of 
1988.87 on Friday, August 28th 2015. This was about a 60 point swing. We are now eyeing three levels of support/resistance as illustrated below. What is not pictured is that we are trading below the 10 day moving average. That looks to be key resistance at the moment. 


The Nasdaq (COMPQ) closed at 4683.92 on September 4th, 2015 versus 4828.33 on August 28th, 2015. Like the DJIA and the SPX, we are seeing the COMPQ present a similar pattern. Though in our opinion, the DJIA and SPX look weaker and quite possibly could present more short term trading opportunities. 


J. C. Penney (JCP) has a number of bullish patterns working for it on the weekly charts. Back in late 2013 and early 2014, we can see an inverse head and shoulders pattern that formed. It was triggered but would be quickly sold and killed off. Then again in late 2014 and early 2015, JCP again tried to develop a small inverse head and shoulders pattern that triggered and we are seeing it unfold now. It's most recent bullish pattern is a break of the trading range. We estimate a target of $10.3 for this pattern.


Disclosure: We have a position in JCP at the time this article was first written.

The information provided on this site is not advice to buy, sell, hold, trade, or invest in any securities. I am not a financial professional. Do your own research before acting on any information provided on this site.
[Continue reading...]

Stock Market Indices Review for Week 35 in 2015

Aug 29, 2015 -

Stock Market Highlights - Week 35


- Fed's Fischer: Too early to decide on Sept hike.
- WTI was $45.22 and brent crude oil $50.02 on 8/28. Signs of reversal?
- Second Estimate: US 2Q15 Gross Domestic Product Expands by 3.7%.
- Buffett's Berkshire takes $4.48 billion stake in Phillips 66.
- Brazil has entered recession as country's economy contracted by 1.9%.


The Dow Jones Industrial Average (DJIA) closed at 16643.01, which was about a 200 point increase versus a week ago of 16459.75 on Friday, August 21st 2015. We are seeing a small bounce back from the lows of Monday. This volatile price action could suggest further volatile action to come. We'll need to watch to see if the price action can over take the 20DMA or if that becomes resistance. A bounce was likely as we heavily selling that led to price levels that were not seen in almost a year. 

If indeed we are in the beginnings of a correction, I'd almost want to short at the 20DMA and then put my stop just above that and a target of the Monday lows. However, we'll continue to check price action and see what happens before making any decisions. 


The S&P 500 closed at 1988.87 on Friday, August 28th 2015 versus a week ago of 
1970.89 on Friday, August 14th 2015. This was about a 19 point swing back up. We are now eyeing the 2040 level as that had been support prior and is right next to the 20DMA. It is likely that we would see a retest of that level, however we'll have to see where the price action takes us next week.  


The Nasdaq (COMPQ) closed at 4828.33 on August 28th, 2015 versus 4706.04 on August 14th, 2015. We are likely to see resistance at 4900 as that was prior support. There are a couple gaps just above current price levels that programs will be targeting to fill. 


The last two trading sessions had oil jump up. For the first time in over two months, we finally see that the downtrend has been broken. On the UCO (ProShares Ultra DJ-UBS Crude Oil) you can see that we closed above the 20DMA, however we shall see if this will hold up.


Disclosure: We have a position in UCO and UPRO at the time this article was first written.

The information provided on this site is not advice to buy, sell, hold, trade, or invest in any securities. I am not a financial professional. Do your own research before acting on any information provided on this site.
[Continue reading...]

Stock Market Indices Review for Week 34 in 2015

Aug 22, 2015 -

Stock Market Highlights - Week 34


- U.S. markets tumbled more than 5% as worries mounted over state of the global economy.
- WTI was $40.45 and brent crude oil $45.46 on 8/22. Still no bottom on oil prices, yet.
- Alibaba shares plunge closer to $68 IPO level.
- Uber projects three-fold rise in 2015 bookings worth $10.84B.
- Valeant to buy female Viagra maker Sprout Pharma for $1B.


The Dow Jones Industrial Average (DJIA) closed at 16459.75, which was about a 1017 point decrease versus a week ago of 17477.4 on Friday, August 14th 2015! If you still don't believe we are in a downtrend, then I don't know what to tell you. As we had mentioned last week, in order for the bulls to take control we wanted to see price action above 17610. Well, the bears ripped that dream from the bulls. Instead we saw massive selling and the fact that it closed at the low of the day is not a good sign for the bulls. 

Though the bears appear to be in charge in the short-term, for those who are not short the market, we would want to wait for a pull back before trying to chase this sucker down. 


The S&P 500 closed at 1970.89 on Friday, August 14th 2015 versus a week ago of  2091.54 on Friday, August 7th 2015. This was about a 120 point swing to the downside. Last week, we said that it could go either way. The market decided to pick the downside and with conviction it did. 

We were ready to pick a side at the first indicator of where the market was headed. Wednesday's price action was a hint of what was to come, however it managed to hold at the 200 DMA by the end of the day. However, when the market opened just below the 200 DMA on Thursday, that was our signal to watch for downward action. We initiated a small position shorting small caps on Thursday, August 20th.


The Nasdaq (COMPQ) closed at 4706.04 on August 14th, 2015 versus 5048.23 on August 7th, 2015. We saw signs of deterioration last week and now we have confirmation. These gap downs in the last two days were even more aggressive than that of the SPX and the DJIA. Still the action suggests we are not done and the dust has not settled. Like the DJIA, this would not be a time to chase this price action. We would like to see it pull back and then enter on confirmation of further continuation of bearish action. 


FitBit Inc. (FIT) has been a mention of ours in the past few market reviews. It is a fitness band designer and manufacturer. Also one of our most profitable trades in the last two months. 

After disappointing the market on earnings, the stock gapped down. Our play was a gap fill, however we needed to see price action reverse. At the first sign of such action, we entered in and got denied at the 20 DMA, where we prompted exited. 


Disclosure: We do not have a position in FIT at the time this article was first written.

The information provided on this site is not advice to buy, sell, hold, trade, or invest in any securities. I am not a financial professional. Do your own research before acting on any information provided on this site.
[Continue reading...]

Stock Market Indices Review for Week 33 in 2015

Aug 15, 2015 -

Stock Market Highlights - Week 33

- Google creates a new holding company called ‘Alphabet’ to hold a collection of companies.
- WTI was $42.23 and brent crude oil $49.22 on 8/14. See no bottom on oil prices, yet.
- Buffett's Berkshire sheds National Oilwell Varco and Phillips 66 stock.
- JC Penney's net revenue totaled $2.88B, up from $2.80B during the same period last year.
- British trader charged in '2010 U.S. Markets Flash Crash' released after bail reduction


The Dow Jones Industrial Average (DJIA) closed at 17477.4, which was about a 104 point decrease versus a week ago of 17373.38 on Friday, August 7th 2015. We've are now in a pretty clear downtrend and this is evidently favorable for bears. For the bulls, we'd like to see price action above 17610 or the 20 DMA. This would signify a return to the prior trading range. 

Though the bears appear to be in charge in the short-term, currently there appears to be no good short opportunities. We want to limit our risk to reward ratio when entering trades. One way of doing this is through position sizing. However, I digress. In any event, a move towards the 20 DMA or the 50 DMA present low risk short opportunities. In addition, I'd like to see the STO (stochastics indicator) overbought. That is the trend follower stock plan.


The S&P 500 closed at 2091.54 on Friday, August 14th 2015 versus a week ago of 
2077.57 on Friday, August 7th 2015. This was about a 14 point swing to the upside. It looks like we are just ping ponging back and forth and have formed a symmetric triangle. Typically, this means there will be a break in either direction.  

To us the SPX looks fairly neutral right now, meaning there is no clear indicator as to whether we will see further downside or upside action. For now, it appears to be consolidating horizontally. However, if we had to pick a side and just based on recent market action, more downside action could happen.


The Nasdaq (COMPQ) closed at 5048.23 on August 14th, 2015 versus 5043.54 on August 7th, 2015. Once one of the strongest in the group, COMPQ is now showing signs of deterioration. We can see a bearish head and shoulders chart pattern below. The top of the triangle being the head and the two sides being shoulders. Like the SPX it now looks like the COMPQ is in neutral territory with a hint of bearish indicator. When we see this sideways action occur, it is typically a stock picker's market. That means you will find stocks that break out and break down. You just have to be picky with what you select. This is in contrast to a bullish market where every other stock just goes up or alternatively a bearish market where just about everything goes down. 


Etsy Inc. (ETSY) is a marketplace similar to that of Amazon and Ebay, but in a niche market of handmade or craft goods. Its recent IPO allowed individual investors to purchase stock at a price of $16, which we were able to take full advantage of. The day it started trading on the market, the stock shot up to $30. Whereby we sold the day after for a hefty profit. 

However, since then the stock has missed earnings expectations and still continues to show a net loss on its profit and loss statements. The market has not been kind to it as we've seen it trade as low as $13-$14 a share. There were two opportunities to take advantage here. The first in July and the second in the following month August. First, in July we saw a reversal of the downward trend and in August a double bottom. 

Though it is possible that we will see a complete gap fill of the gap down in August, current price action shows some weakness. We'd like to see a close above the 18 price level to see if it can make a run at $22. 


Disclosure: We do not have a position in ETSY at the time this article was first written.

The information provided on this site is not advice to buy, sell, hold, trade, or invest in any securities. I am not a financial professional. Do your own research before acting on any information provided on this site.
[Continue reading...]

Stock Market Indices Review for Week 32 in 2015

Aug 7, 2015 -

Stock Market Highlights - Week 32

- Fitbit Quarterly revenue jumped up to $400.8 million, which beat a $319 million forecast.
- WTI was at $44.66 and crude oil $49.52. Oil prices continue to decline.
- Disney revenue in its third quarter totaled $13.1B, a 5% increase last year same period.
- U.S. unemployment rate held at a seven-year low of 5.3%.
- Service Industries in the US expanded at the fastest pace in a decade.


The Dow Jones Industrial Average (DJIA) closed at 17373.38, which was about a 316 point decrease versus a week ago of 17689.86 on Friday, July 31st 2015. We've now broken the trading range and it is confirmed that we are trending downward. This is looking good for the bears in the mid-term (weeks to months). 

However, from a a short-term perspective (days - a week), we see a potential reversal looming. With the hammer pattern on Friday, we should be looking out for a follow through confirmation bullish candle on Monday. This is somewhat likely considering how oversold the DJIA is. A potential trade would be to go long the DIJA and put your stop just below the hammer pattern. 


The S&P 500 closed at 2077.57 on Friday, August 7th 2015 versus a week ago of 
2103.84 on Friday, July 31st 2015. This was a 26 point swing downward. Essentially of all last week's gains have been wiped out. 

Similar to the DJIA chart, we see hammer candlestick. However, without any confirmation of this bullish candle, we can only guess if this is a true indicator of positive prices to come. If you look closely, you can see that the 50 DMA crossed the 20 DMA and this is otherwise known as the "deathcross". This is definitely a bearish signal. Though I would wait until I see a run up back to overbought territory before trying to short this market.


The Nasdaq (COMPQ) closed at 5043.54 on August 7th, 2015 versus 5128.28 on July 31st, 2015. The strongest of the three indices continue to be the COMPQ. However, the head and shoulders bearish chart pattern has revealed itself. Of the three indices we've reviewed, this one seems to be the hardest to short. Though a break of the neckline at around 5000 and follow through will suggest that we will see lower prices. 


Starbucks (SBUX) was a stock that we reviewed last week. When we spoke of the chart, we liked the up trending prices, but did not like the price at the time. Well we waited for a retest of the 20DMA and lone behold, it arrived just today. 


Therefore, we dumped our Facebook (FB) position in favor of SBUX. While FB looks like it is forming a bullish flag, the SBUX chart looked stronger. 

Disclosure: We have a position in SBUX.

The information provided on this site is not advice to buy, sell, hold, trade, or invest in any securities. I am not a financial professional. Do your own research before acting on any information provided on this site.
[Continue reading...]

Stock Market Indices Review for Week 31 in 2015

Aug 1, 2015 -

Stock Market Highlights - Week 31

- Uber just beat Facebook's venture-backed company record at over $50 billion.
- WTI was 8/1 at $47.12 and crude oil $52.21. Oil prices continue to decline.
- Frontier Communications to acquire Verizon's wireline operations for $10.54 billion.
- Exxon (52% drop in profit vs. Q2 2014) report worst quarterly result of current decade.
- Expedia Inc. revenue grew 11% Q2 2015 vs Q2 2014 to 1.66 billion.


The Dow Jones Industrial Average (DJIA) closed at 17689.86, which was about a 120 point increase versus a week ago of 17568.53 on Friday, July 24 2015. The market traded below the previously indicated trading range before jumping right back into it. Most certainly this is a choppy market and when there is a choppy market, it becomes a stock picker's market. Pick the right stocks and you will make money versus in an uptrend market most any stock will go up. 

At this time it does not look like there are any good risk/reward opportunities to go either long or short on the weekly time frame. Though upon closer inspection, you could argue going short with a stop at the 20 DMA (day moving average) of 17800 is a market play. The fact that it is still trading below the 20 and 50 DMA is a bearish sign. 


The S&P 500 closed at 2103.84 on Friday, July 31st 2015 versus a week ago of 2079.65 on Friday, July 24th 2015. This was a 24 point swing upward. Nothing to really write home about here. The chart is in the trading range and trading above the 20 and 50 DMA, which makes it some what neutral. I'd sit and wait to see what happens during the week. 

This is a stronger chart than the DJIA and if you wanted to pick stocks that will go up you had a better chance with stocks in the SPX than in DJIA this past week.


The Nasdaq (COMPQ) closed at 5128.28 on July 31st, 2015 versus 5088.63 on July 24th, 2015. The strongest of the three indices is still the COMPQ. After a quick, but painful test of the 50 and 20 DMA, it looks like the COMPQ has resumed its upward trend. However, we'll want to see a break of 5175 to see if that is the case. If not, I suspect range trading similar to that of the DJIA and the SPX to unfold. 


Starbucks (SBUX) has been committed to ethically sourcing and roasting the highest quality arabica coffee on the planet. I like to call it the legal drug. Coffee is ridiculously addicting for some people. For some people, they drink Starbucks three times a day and it becomes part of their routine. 

My biggest mistake was selling SBUX two year ago as it has what looks like at least doubled in value. In any event, this chart is almost as pure as it comes - a beautiful uptrend following the 20DMA. SBUX recently broke away from that. While I wouldn't be surprised to see it take off, I see a better entry point when it comes back or if it comes back to the 20DMA.


Disclosure: I do not have a position in SBUX.

The information provided on this site is not advice to buy, sell, hold, trade, or invest in any securities. I am not a financial professional. Do your own research before acting on any information provided on this site.
[Continue reading...]

Stock Market Indices Review for Week 30 in 2015

Jul 24, 2015 -

Stock Market Highlights - Week 30

- Amazon stock surges 17% as earnings beat expectations.
- WTI was 7/24 at $48.14 and Crude Oil $52.62. Oil prices continues its rapid decline.
- Anthem to buy Cigna for $54 billion, creating nation's largest insurer.
- US new home sales at seven-month low; manufacturing stabilizes.
- AT&T gets FCC approval, immediately completes $49-billion takeover of DirecTV.


The Dow Jones Industrial Average (DJIA) closed at 17568.53 on Friday, July 24 2015, which was about a 517 point decline versus a week ago of 18086.45 on Friday, July 17 2015. We've seen the market try and retest the top, but it ran out of momentum at 18100 and was quickly sold. Four consecutive red days after a bullish run is not a good sign for bulls. We continue to be in a wicked trading range beginning in March. 

There will most probably be another retest of the bottom of the range. This time it might not be so friendly. The previous bounce was a hard fought bounce. Would not be surprised if we actually broke below this range this time. 


The S&P 500 closed at 2079.65 on Friday, July 24th 2015 versus a week ago of 2126.64 on Friday, July 17th 2015. This was a 47 point swing downward. While this chart is a bit stronger than the DJIA, we still see that it is definitely in a trading range. I'd expect to see a retest of the bottom range as we are not yet oversold. 

For the bulls any trade at the bottom of the range with a tight stop is good risk to reward. Any break below the trading range then I suggest you go short. 


The Nasdaq (COMPQ) closed at 5088.63 on July 24th, 2015 versus 5210.14 on July 17th, 2015 . The strongest of the three indices is still the COMPQ. We noticed that the indicators still show that it is not yet oversold and that we have yet to retest the 50 or 20 DMA, which means that the trading trend is intact. 

The stocks in the Nasdaq include but are not limited to Google, Facebook, eBay, Dish Network, Costco, Amazon, and Apple. So you can see why the Nasdaq is still above water. The past few weeks, Amazon and Google have performed relatively better than its peers. 


Shake Shack is a modern day 'roadside' burger stand serving the most delicious burgers, fries, hot dogs, frozen custard, beer, wine and more! We've covered Shake Shack in the past before. There were two very good buy opportunities that we were not able to take advantage of as we were in FIT. In any event, the first occurred early April and then again in early July. We saw selling action from Jun through mid July as the price reached about $96.

The second opportunity was a the close of the high and low bar of the previous day. The stop would've been right where the blue line is. If I held the position today, I would put my stop at the 20 DMA. Though it is likely that it will break through that as indicators show it is overbought. 


Disclosure: I do not have a position in SHAK.

The information provided on this site is not advice to buy, sell, hold, trade, or invest in any securities. I am not a financial professional. Do your own research before acting on any information provided on this site.
[Continue reading...]

Stock Market Indices Review for Week 29 in 2015

Jul 19, 2015 -


Stock Market Highlights - Week 29

- Q2 2015 S&P 500 earnings stand at $28.61, a 3.8% decline in growth year-over-year.
- WTI was 7/19 at $59.89 and Crude Oil $57.72. Oil prices continues to decline.
- US jobless claims dropped for the first time in 4 weeks, according to the Department of Labor
- Google's Share price hits all-time high, closed at 672.93 .
- Retail sales reduced 0.3% last month, the weakest reading since February.


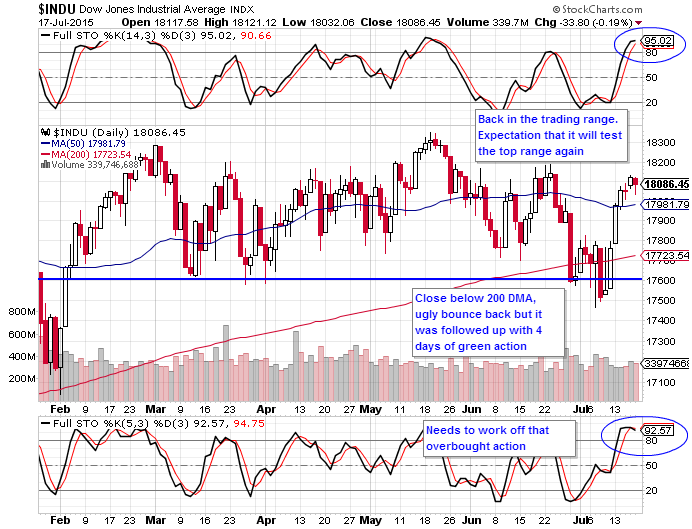
The Dow Jones Industrial Average (DJIA) closed at 18086.45 on Friday, July 17 2015, which was about a 326 point decline versus a week ago of 17760.41 on Friday, July 10 2015. The DJIA dipped below the trading range for the first time in four months. However, managed to bounce back though unconvincingly. It took several attempts before breaking above the 200 DMA. You'll notice as we go through the other charts, this is the weakest of the three indices. We should see a retest of the top trading range. 

After four consecutive positive trading days, the market took a break near 18000. The short-term stochastic (STO) indicators now show overbought conditions. Don't be surprised to see some consolidation to work off that overbought condition or a pullback. 


The S&P 500 closed at 2126.64 on Friday, July 17th 2015 versus a week ago of 2076.62 on Friday, July 10th 2015. This was a 50 point swing upward. The S&P experienced a huge drop toward the 200 DMA, and like the DJIA struggled to make a convincing V-shaped bounce like we've seen in the past. Nonetheless, it did recover and is now trading above the 50DMA.

The STO levels suggest that a period of consolidation or pullback is likely to follow. This is especially the case now that we are toward the top of the trading range. The doji (cross) at the top of chart is just another indication that we may be at a top of this leg up. 


The Nasdaq (COMPQ) closed at 5210.14 on July 17th, 2015 versus 4997.70 on Friday, July 10th . The strongest of the three indices is still the COMPQ. To our amazement, the COMPQ made a new high. Not only that, but it also closed near the top of the high of the day. Without a doubt this is positive action of the chart. Although it is overbought at the moment, further run up is possible before we see any consolidation or pullback. 

Notice that we did not even come close to testing the 200 DMA on this chart. Just incredible strength despite the weakness we see in the DJIA and the S&P. 


Etsy, Inc. (Etsy) operates a marketplace where people around the world connect, both online and offline, to make, sell and buy unique goods. My first position in the stock was when it first IPOed, we were able to get in at the great price of $16 per share. The first trading day it jumped up towards $30 and then we dumped it the second day due to weakness. 

Needless to say the stock had been on a downward spiral ever since. Our analysis taking eBay's IPO price relative to its earnings, tagged Etsy to be valued at around $12 per share. It didn't get that low, so we didn't enter the stock. However, from a technical analysis standpoint, the breakout of the trading range was the first buy signal. Then the breakout of the 50 DMA was the second. 

We would wait for a consolidation or another trading setup as we've already missed the last two opportunities. 


Disclosure: I do not have a position in ETSY.

The information provided on this site is not advice to buy, sell, hold, trade, or invest in any securities. I am not a financial professional. Do your own research before acting on any information provided on this site.
[Continue reading...]

Stock Market Indices Review for Week 28 in 2015

Jul 11, 2015 -


Stock Market Highlights - Week 28

- Janet Yellen reaffirmed America's central bank intends to raise interest rates this year.
- WTI closed 7/11 at $52.74 and Crude Oil $58.73. Oil prices continues to decline.
- P&G dismantling its beauty business with sales of brands 
- New GoPro $400 video camera size of an ice cube.
- Shell hauling two huge rigs in Arctic Ocean to start drilling in days.


The Dow Jones Industrial Average (DJIA) closed at 17760.41 on Friday, July 10 2015, which was about a 30 point decline versus a week ago of 17730.11 on Friday, June 26th 2015. The DJIA dipped below the trading range for the first time in four months. In fact it is now trading just above the 200 DMA. We'll want to see it break back into the trading range at the 17800 level otherwise, expect further downward prices. 

After retesting 17600, the short-term stochastic (STO) indicators bounced off STO 20 and it is now hovering over 40s. We still see that the longer term fourteen day STO is still a bit oversold. The bounce at the 200 DMA has been less then spectacular. I'd expect more downward prices unless we break the 17800 level.  


The S&P 500 closed at 2076.62 on Friday, July 10th 2015 versus a week ago of 2076.78 on Thursday, July 2nd, 2015. The change was flat. The S&P experienced a huge drop toward the 200 DMA and like the DJIA struggled to make a convincing V-shaped bounce. It appears as if it is forming a bearish flag, which would suggest further decline in prices.

The STO levels suggest that the bounce was less than strong. Even when they are showing it is not overbought, they are declining. We can see that the STO levels (five day) peaked at 50 and then declined to 30s versus a peak above 20 in the fourteen week STO indicator and a decline at 17 by the end of the week. This suggests weakness in the markets. 


The Nasdaq (COMPQ) closed at 4997.70 on Friday, July 10th versus 5009.21 on Thursday, July 2nd 2015. The strongest of the three indices is still the COMPQ. As with the action we saw last week, the trend has been broken and now we are failing to make higher highs. This is also a clear indication that the markets are beginning to turn. Unless we can see a solid bounce back into the trading range, expect lower prices. 


Fitbit, Inc. (FIT) is a makers of fitness bands. It has also been a focused long-stock in weeks prior namely due to its strong price action despite the downturn in the markets. Last week was  week of consolidation. FIT tried to work off overbought conditions and did so wonderfully. It hovered around 40-44 last week, which sets it up perfectly for a breakout above the $44 level. We doubt that this will reach STO oversold before it sees higher prices. Right now we are targeting $47.61. 

We entered into the position at $34.61 on 6/26 and it is up about 20%. 


Disclosure: I have a long position in FIT.

The information provided on this site is not advice to buy, sell, hold, trade, or invest in any securities. I am not a financial professional. Do your own research before acting on any information provided on this site.
[Continue reading...]
 
Copyright © 2007- StockKevin. Disclaimer. All Rights Reserved.