
Stock Market Highlights - Week 29
- Q2 2015 S&P 500 earnings stand at $28.61, a 3.8% decline in growth year-over-year.
- WTI was 7/19 at $59.89 and Crude Oil $57.72. Oil prices continues to decline.
- US jobless claims dropped for the first time in 4 weeks, according to the Department of Labor- Google's Share price hits all-time high, closed at 672.93 .
- Retail sales reduced 0.3% last month, the weakest reading since February.

After four consecutive positive trading days, the market took a break near 18000. The short-term stochastic (STO) indicators now show overbought conditions. Don't be surprised to see some consolidation to work off that overbought condition or a pullback.
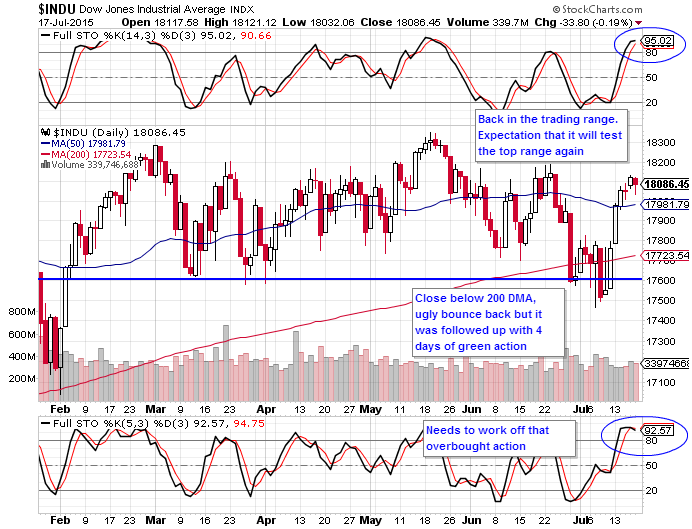
The STO levels suggest that a period of consolidation or pullback is likely to follow. This is especially the case now that we are toward the top of the trading range. The doji (cross) at the top of chart is just another indication that we may be at a top of this leg up.

Notice that we did not even come close to testing the 200 DMA on this chart. Just incredible strength despite the weakness we see in the DJIA and the S&P.

Etsy, Inc. (Etsy) operates a marketplace where people around the world connect, both online and offline, to make, sell and buy unique goods. My first position in the stock was when it first IPOed, we were able to get in at the great price of $16 per share. The first trading day it jumped up towards $30 and then we dumped it the second day due to weakness.
Needless to say the stock had been on a downward spiral ever since. Our analysis taking eBay's IPO price relative to its earnings, tagged Etsy to be valued at around $12 per share. It didn't get that low, so we didn't enter the stock. However, from a technical analysis standpoint, the breakout of the trading range was the first buy signal. Then the breakout of the 50 DMA was the second.
We would wait for a consolidation or another trading setup as we've already missed the last two opportunities.

Disclosure: I do not have a position in ETSY.